Saturday, August 31, 2013

The Gold And Silver Bulls Are Here

In the past I've written countless articles about gold (GLD) and silver (SLV), claiming they're going to be great long-term bets no matter what they currently trade for, and that they're both looking relatively cheap to purchase in 2013 after their prices fell significantly over the past few years. For months, people have informed me that I've looked like an idiot. Now it's starting to look like ole' QTR may have been onto something after all.

To reiterate, for the millionth time, let me just set the record straight on where I sit with precious metals. I come from the "old school" of Austrian economics. Austrian economics dictate that market corrections and pullbacks are good things. They represent the actual supply and demand of products and services and how they correspond to a company's valuation. This is important because the one time that precious metals always flourish is during market corrections and pullbacks. While Keynesian could be great for gold and silver as people should be realizing the bubbles that we make, what it really does is create big downtrends in the precious metals like the last few years, as people stupidly take on the attitude that "the Fed won't let anything bad happen to us".

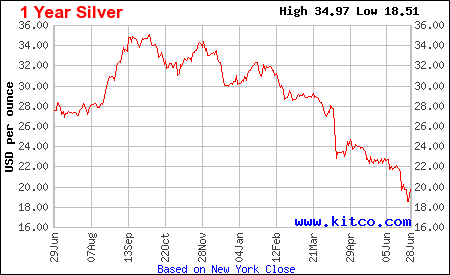
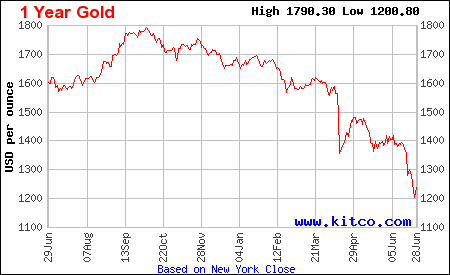
Speaking of the Fed crushing gold and silver prices, you can see how both metals have fared over the past year, through the beginning of their bullish trends that generally started heading in to the early stages of July:

Crikey! Now, let's look over the story of the past six months. From a technical perspective, there's a lot of recent bullish sentiment in the six month chart for both SLV and GLD.

(click to enlarge)

Silver has returned to over the $20 region for the first time since late June. It's showing a significant break of its previous downtrend, something that technical traders are going to like; and something that's going to ping through on a lot of automated trading screens. Gold has experienced the same type of trend reversal beginning, as you can see below.

(click to enlarge)

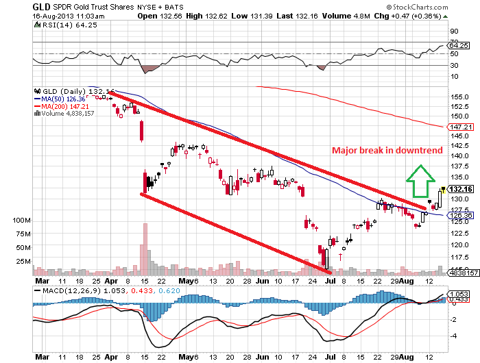
Now, I'm reiterating my continued bullish sentiment on both metals, as gold and silver seem primed to run again. They've been climbing like a bat out of hell over the last seven sessions preceding August 16th, with silver showing successive percentage gains that the precious metal hasn't seen in years.

The Wall Street Journal commented on Friday:

Silver settled in bull-market territory Thursday, while gold set a fresh eight-week high, as concerns about violence in Egypt and losses in equity markets led investors to buy haven assets.

Silver for September delivery, the most active contract, rose $1.148, or 5.3%, to settle at $22.935 a troy ounce on the Comex division of the New York Mercantile Exchange.

The contract is up 23.6% from its June settlement low of $18.553, placing it firmly in bull-market territory--defined as a roughly 20% rise off a recent low.

Gold for December delivery, the most active contract, rose $27.50, or 2.1%, to settle at $1,360.90 a troy ounce.

Both precious metals turned higher amid increased attention on Egypt, where a crackdown on protesters left at least 525 people dead.

President Barack Obama on Thursday condemned the violence in Egypt and cancelled plans to hold joint military exercises with the country next month.

"The Middle East is accenting the need for gold," said George Gero, a senior vice president with RBC Capital Ma! rkets Glo! bal Futures.

Mr. Gero said that the escalating violence brings with it political and economic uncertainty, and many investors in the Middle East are turning to gold in order to preserve their wealth amid these worries.

"Gold is still the ultimate haven for people who are concerned about currency values in their own countries," he said.

Gold's rally kicked into higher gear after prices breached above the $1,340 level, where many bearish investors had positioned so-called "stop loss" orders, said Bill Baruch, a senior market strategist with Chicago-based brokerage iiTrader. These automatic trades are triggered if market prices rise above a certain level and are authorized to purchase gold in order to close out bets on lower prices.

Silver's move was catalyzed not only by gold's run, but more importantly for silver, due to better outlooks for industry worldwide. Silver has the unique advantage over gold in that it is used not only to be held in reserves, but also for industry. Not only that, it's used significantly in industry, which is why news of bullish industry worldwide is something often has direct ties to silver's spot price. Additionally, both silver and gold have been benefiting from middle east unease and losses in equity markets globally.

As reported by CNBC.com, analysts are starting to get bullish on the metals as well:

Lennox said the factors that helped spur silver's rally will continue to push the metal higher this year, and said it could hit highs of $30 to $35 before the end of the year.

Furthermore, silver's dramatic rally over the past week is bound to attract investor attention and help fuel further gains, added.

"There is one good way to get yourself on the radar, and that's to have a good price rally, all the speculators pick up on it and it then become self-feeding," he added.

IG's Shamu forecasts that silver will reach $24-25 an ounce in the short term, and highs of $28 by the end of the year.

"It! looks like the trend in the short term for gold and silver is upwards they've broken through some key resistance levels," said Shamu.

There isn't so much risk as there is a learning curve with metals. With precious metals, there's lessons to learn right off the bat. One of the first things that I found out as a novice investor was that gold stocks are much riskier than gold itself. ETFs that include gold mining companies often move with much wilder swings than the underlying commodity. Individual stocks are even riskier. It's important to remember that gold and silver business stocks can go under even when the underlying commodity does not. You have to remember that you're betting on a metal-based business when you buy the stock, not the commodity price directly.

Best Casino Stocks For 2014

I love the investing method of simply buying gold and silver bullion and holding it in your own "personal reserve". Betting on the companies comes with some added risk.

The other common way to invest is through ETFs such as iShares Gold Trust (IAU), which basically track the price of the commodity by physically purchasing bullion. The ETFs asset price reflect the price as which it trades for. If the underlying asset is silver, the ETF trades proportional to what the silver's worth.

ETFs are an incredibly easy way to trade silver and gold in the account that you already have and can be traded very quickly, unlike physical silver and gold. ETFs are a much quicker and much more convenient way to trade these metals.

Arguments against ETFs include the fact that they cannot be simply traded for the metals, they're not a great hedge against stock volatility, and there's usually a management fee associated with ETFs. Questions are often raised about the fact that ETFs don't necessarily need to disclose the actual trust holdings, in terms of how much gold they actually have in trust. If you're holdin! g physica! l, you know exactly what your personal holdings are because you can just open your eyes and take a gander whenever you please.

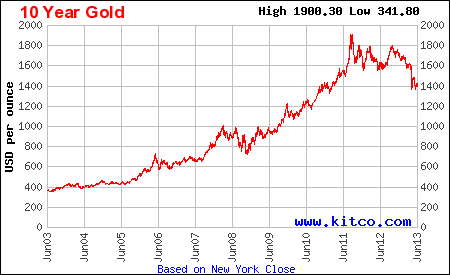
To further make my point about precious metals being good long-term investments, take a look at silver & gold's long-term charts compared to their one year charts:

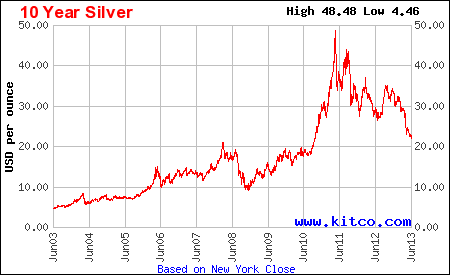
The metals are both experiencing insane returns over the last 20-year period and are both arguably in the middle of a tremendous long-term bull run. There are tons of arguments out there against gold and silver, as you may have noticed over the past couple of years, but in the long term, as long as we are not heading back to the gold standard, both metals will rise in value correlating with inflation.

On the spurs of this rally beginning again, I continue to remain bullish on gold and silver going forward, for the foreseeable future and wish all traders the best of luck.

Source: The Gold And Silver Bulls Are Here

Disclosure: I have no positions in any stocks mentioned, and no plans to initiate any positions within the next 72 hours. I wrote this article myself, and it expresses my own opinions. I am not receiving compensation for it (other than from Seeking Alpha). I have no business relationship with any company whose stock is mentioned in this article. (More...)

Wednesday, August 28, 2013

American Axle's Tech in Qoros Vehicle - Analyst Blog

Best Undervalued Stocks To Invest In 2014

American Axle and Manufacturing Inc. (AXL) has won a contract from Qoros Auto Co. to deliver advanced hybrid and electric driveline system featuring e-AAM technology. Investment in the driveline system enabled the company to develop an innovative patent-protected product portfolio; thus allowing it to command a dominant position in the segment.

The advanced e-AAM technology will provide a cost-efficient solution with dominant power density, a high degree of modularity and a full scope of controls and software. Customers will thus be benefited due to better fuel efficiency, lower CO2 emissions and improved safety, ride and handling performances.

The e-AAM technology will be featured in the future model year of Qoros vehicle, which will be manufactured in China. The other features in the e-AAM hybrid and electric driveline systems are electric drive unit, power box unit with an electric drive control module and a proprietary control strategy and software, which is designed for traction and hybrid controls functionality.

Headquartered in Shanghai, China, Qoros is an automotive manufacturing company. Qoros is a joint venture between Chery Automobile Co. and Israel Corporation.

American Axle is a leading supplier of driveline systems, modules and components for the light vehicle market. The company makes axles, driveshaft and chassis components for light trucks, sport utility vehicles and passenger cars.

American Axle is expected to grow on the back of its numerous product launches, which feature advanced driveline technology, and customer diversification. It has a Zacks Rank #2 (Buy).

American Axle reported earnings of $18.6 million or 23 cents per share before debt refinancing and redemption costs in the first quarter of the year, down 62.3% from 61 cents per share in the comparable quarter of 2012 (excluding special item! s). Nevertheless, earnings surpassed the Zacks Consensus Estimate of 15 cents.

Revenues of $755.6 million in the quarter were slightly higher compared with $751.5 million in the first quarter of 2012, but missed the Zacks Consensus Estimate of $757.0 million. The company's revenues reflect the adverse impact related to the labor strike at General Motors' (GM) Rayong plant in Thailand.

Some stocks that are performing well in the industry where American Axle operates include Visteon Corp. (VC) and Magna International Inc. (MGA). They carry a Zacks Rank #1 (Strong Buy).

Monday, August 26, 2013

Will United Continental Continue Its Path to Higher Prices?

With shares of United Continental Holdings (NYSE:UAL) trading around $32, is UAL an OUTPERFORM, WAIT AND SEE or STAY AWAY? Let's analyze the stock with the relevant sections of our CHEAT SHEET investing framework:

T = Trends for a Stock’s Movement

United Continental Holdings is a holding company and its principal, wholly owned subsidiaries are United Air Lines and Continental Airlines. The company transports people and cargo through its mainline and regional operations. It also has contractual relationships with various regional carriers to provide regional jet and turboprop service branded as United Express. Companies and consumers worldwide look to travel at increasing rates since air travel is quicker and is becoming less expensive. As costs decrease and flights become more efficient, United Continental stands to see soaring profits as consumers and businesses look to travel more than ever.

NEW! Discover a new stock idea each week for less than the cost of 1 trade. CLICK HERE for your Weekly Stock Cheat Sheets NOW!

Top 10 Energy Companies To Invest In 2014

T = Technicals on the Stock Chart are Strong

United Continental Holdings stock has recently broken above a consolidation range established over the last two years. The stock looks set to test prices not seen since before the 2008 Financial Crisis. Analyzing the price trend and its strength can be done using key simple moving averages. What are the key moving averages? The 50-day (pink), 100-day (blue), and 200-day (yellow) simple moving averages. As seen in the daily price chart below, United Continental Holdings is trading above its rising key averages which signal neutral to bullish price action in the near-term.

UAL

(Source: Thinkorswim)

Taking a look at the implied volatility (red) and implied volatility skew levels of United Continental Holdings options may help determine if investors are bullish, neutral, or bearish.

Implied Volatility (IV)

30-Day IV Percentile

90-Day IV Percentile

United Continental Holdings Options

43.82%

43%

40%

What does this mean? This means that investors or traders are buying a significant amount of call and put options contracts, as compared to the last 30 and 90 trading days.

Put IV Skew

Call IV Skew

July Options

Average

Average

August Options

Average

Average

As of today, there is an average demand from call and put buyers or sellers, neutral over the next two months. To summarize, investors are buying a significant amount of call and put option contracts and are leaning neutral over the next two months.

On the next page, let’s take a look at the earnings and revenue growth rates and the conclusion.

E = Earnings Are Decreasing Quarter-Over-Quarter

Rising stock prices are often strongly correlated with rising earnings and revenue growth rates. Also, the last four quarterly earnings announcement reactions help gauge investor sentiment on United Continental Holdings’s stock. What do the last four quarterly earnings and revenue growth (Y-O-Y) figures for United Continental Holdings look like and more importantly, how did the markets like these numbers?

NEW! Discover a new stock idea each week for less than the cost of 1 trade. CLICK HERE for your Weekly Stock Cheat Sheets NOW!

2013 Q1

2012 Q4

2012 Q3

2012 Q2

Earnings Growth (Y-O-Y)

27.94%

-38.10%

-32.50%

-5.37%

Revenue Growth (Y-O-Y)

1.38%

-2.53%

-2.58%

1.33%

Earnings Reaction

-1.59%

2.15%

-4.98%

-5.92%

United Continental Holdings has seen mostly decreasing earnings and mixed revenue figures over the last four quarters. From these numbers, the markets have expected a little more from United Continental Holdings’ recent earnings announcements.

P = Excellent Relative Performance Versus Peers and Sector

How has United Continental Holdings stock done relative to its peers, Delta Air Lines (NYSE:DAL), Southwest Airlines (NYSE:LUV), US Airways Group (NYSE:LCC), and sector?

United Continental Holdings

Delta Air Lines

Southwest Airlines

US Airways Group

Sector

Year-to-Date Return

38.67%

59.77%

35.55%

27.85%

31.72%

United Continental Holdings has been a relative performance leader, year-to-date.

Conclusion

United Continental Holdings provides access to quick and efficient air travel to consumers and companies across the nation. The stock has recently broken out and looks keen to test prices not seen since before the Financial Crisis. Over the last four quarters, investors in the company have expected a little more as earnings have decreased a bit while revenue figures have been mixed. Relative to its peers and sector, United Continental has been a year-to-date performance leader. WAIT AND SEE what United Continental does in coming quarters.

Sunday, August 25, 2013

TJX Corp a Winner as Consumers Shop Less, Lazard Capital Says

If anything became apparent during the recent stretch of disappointing same-store sales reports and earnings announcements from retailers, its that something consumers are clearly spending less.

Getty Images

It’s gotten bad enough that Lazard Capital Market’s Jennifer Davis posed the question “What’s happened to the consumer?” in a report released today, as she considers next week’s announcements from American Eagle Outfitters (AEO), Aeropostale (ARO), the Gap (GPS), L Brands (LTD) and TJX (TJX). She writes:

The consumer has clearly cut back spending at department stores and specialty apparel retailers (as we have been saying throughout the quarter). The question is why. We have several theories: (1) a shift in wallet share toward automobiles and houses (see Exhibits 2-4), (2) a lack of meaningful new fashion trends (on top of LY's strong color cycle), and (3) a compressed spring/summer season resulting in less of a need for summer apparel. If theory 3 is the case, then consumers should come out and spend for fall/winter. We will be spending a lot of time in the malls over the next several weeks to try to get a better understanding of the mindset of the consumer.

Thank fully, disappointing announcements from other retailers–as well as earlier guidance lower at American Eagle Outfitters and Aeropostale–have set the bar low for earnings. Guidance, however, will matter. Davis sees in line numbers from Aero Postale and L Brands, a big miss at Aeropostale and higher guidance for the full year from the Gap.

The big winner in all this, however, should be TJX–regardless of what happens with earnings. Davis writes:

We have gotten mixed reads on TJX, but whether it beats, misses or hits cons 2Q estimates, we believe it is one of the best positioned retailers in the current environment. The general slowdown in specialty and department store sales has resulted in abundant buying opportunities in the marketplace, and we believe off-pricers like TJX are well positioned to capitalize on those opportunities.

TJX has gained 0.7% to %51.12 today at 12:42 p.m., Aeropostale has gained 0.2% to 12.53 unchanged at $12.50, the Gap has dropped 0.1% to $43.49 and American Eagle Outfitters is unchanged at$16.54. L Brands has dropped 0.8% to $59.62.

Saturday, August 24, 2013

Repeal of Muni Tax-Exempt Status Would Devastate Counties: Report

“Municipal bonds enable state and local governments to build essential infrastructure projects, such as schools, hospitals and roads,” The National Association of Counties helpfully reminds readers in a recent pitch to preserve the tax-exempt status of municipal bonds.

Congress and the administration are currently debating federal tax reform, including a cap or a repeal of the tax-exempt status of municipal bond interest. The group’s analysis of the municipal bond market and of the estimated impact of a 28% cap and a repeal of their tax-exempt status on the 3,069 county governments reveals that:

The tax exemption of municipal bond interest from federal income tax represents one of the best examples of the federal-state-local partnership, they argue.

Top 10 Energy Companies To Buy For 2014

“Because of the federal tax exemption, investors are willing to buy municipal bonds that pay less interest relative to other securities.”

With a cap or a complete elimination of the exemption, the group says, investors will want to receive greater interest payments, which would be borne by the counties, states, localities and state/local authorities. Finally, all Americans, as taxpayers securing the payment of municipal bonds, will incur the cost.

---

Check out 5 Reasons Muni Bonds Will Outperform in 2013 on AdvisorOne.

Friday, August 23, 2013

ING to Launch New Advisor Platform in Q4

ING U.S., through its broker-dealer, ING Financial Partners, says it will roll out a new wealth-management platform for its roughly 1,500 affiliated independent financial advisors and their clients in the fourth quarter of 2013.

Christina Hurley“The new platform consolidates a household’s financial information into one place, making it easier for both the client and his or her financial advisor to see the complete picture, as well as analyze budgets, investments and retirement projections,” said Christina Hurley (left), head of products for ING U.S. Retirement Solutions Individual Markets, in a press release on Wednesday.

5 Best Financial Stocks To Invest In 2014

“We’ve been listening to our financial advisors and are responding with the tools and support they need for their advisory business. We know that their clients need holistic financial planning, and this platform can help align their financial plans to their goals,” explained Hurley.

ING U.S. says that the new platform is based on two key parts: one that offers new online capabilities for both advisors and clients to use independently or at the same time, and another that brings advisors enhanced capabilities to help them manage their business, including the ability to make financial transactions in a single, integrated environment.

Other key benefits and features of the platform are:

“As the need for financial advice continues to grow, tools that help to deepen relationships and accentuate a financial advisor’s value will be increasingly important,” said Andre Robinson, head of advisory business development at ING Financial Partners, in a statement.

“Our new platform will help to increase real-time collaboration with clients. Clients want a complete view of their financial picture at their fingertips, while advisors want tools that help them assess their clients’ financial situation and take action,” Robinson noted.

ING U.S. (VOYA),the American insurance entity of ING Group NV, is in the process of changing its name to Voya Financial in the near future. It completed its IPO in April and expects the name change to be complete by April 2016. The U.S. unit is led by former American International Group executive Rodney Martin.

Sunday, August 18, 2013

Best Financial Stocks To Watch Right Now

The price-to-earnings ratio has its supporters and detractors, but this simple statistic can be an easy way for investors to gauge how cheap an average stock is on the fly. For some stocks, however, the P/E ratio is a misleading statistic -- particularly when earnings betray a poor business model. With stocks' rise this year and earnings on the upswing, however, is the P/E ratio a suitable fit in the medical device industry, particularly as many device stocks have soared in 2013?

Using data compiled by stock screening site Finviz.com, here are three of the cheapest medical device stocks in the industry as sorted by the P/E ratio. Are these picks worth your investment -- or is this simple statistic hiding lagging financials and flailing companies? Motley Fool contributor Dan Carroll tells you what you need to know about the device industry's cheapest pickings below.

Best Financial Stocks To Watch Right Now: ZipRealty Inc.(ZIPR)

ZipRealty, Inc., a residential real estate brokerage company, provides brokerage services to buyers and sellers in the United States. The company, through its Website ziprealty.com, provides access to Multiple Listing Services (MLS) home listings data, including pictures from the local MLSs; and allows consumers to receive an automatic email notification each time a property that meets their desired search criteria, is made available on the local MLSs. Its Website also offers neighborhood data, such as population, comparable home sales, average income, education level, occupation mix, cost of living, crime statistics, weather, school district information, maps, and driving directions; online images and virtual tours; schedule visits; and home offers. In addition, the company operates ZAP, a Web-based agent platform and customer relationship management system integrated to its Website. Its ZAP integrates and records consumer contact information and Website behavior, agent b ehavior, and transaction information into a common platform; and records relevant consumer behavior, such as logon frequency and times, specific homes viewed and printed, searches made by clients, requested visits to view homes, and online offers, as well as captures and stores agent activities, including agent email communications organized by clients. The company offers its services through its agents in Arizona, California, Colorado, Connecticut, Delaware, Florida, Georgia, Illinois, Maryland, Massachusetts, Minnesota, Nevada, New Jersey, New York, North Carolina, Oregon, Pennsylvania, South Carolina, Texas, Utah, Virginia, Washington, and Washington, D.C. ZipRealty, Inc. was founded in 1999 and is based in Emeryville, California.

Best Financial Stocks To Watch Right Now: Mutual Federal Bcp(MFDB.OB)

Mutual Federal Bancorp, Inc. operates as the holding company for Mutual Federal Savings and Loan Association of Chicago that provides various financial services in Chicago. Its deposit products include non-interest-bearing checking accounts, passbook savings, and fixed-term certificates of deposit accounts. The company?s loan portfolio comprises residential mortgage loans, which include one to four-family fixed-rate residential mortgage loans and multifamily residential mortgage loans; loans on deposit accounts; and consumer loans. It also provides insurance brokerage services. The company was founded in 1905 and is headquartered in Chicago, Illinois.Mutual Federal Bancorp Inc operates as a subsidiary of Mutual Federal Bancorp, MHC.

10 Best Clean Energy Stocks To Own Right Now: Apollo Commercial Real Estate Finance (ARI)

Apollo Commercial Real Estate Finance, Inc., a real estate investment trust, engages in originating, acquiring, investing in, and managing performing commercial first mortgage loans, commercial mortgage-backed securities, mezzanine financings, and other commercial real estate-related debt investments in the United States. The company is qualified as a real estate investment trust (REIT) under the Internal Revenue Code. As a REIT, it would not be subject to federal income taxes, if it distributes at least 90% of its REIT taxable income to its stockholders. The company was founded in 2009 and is headquartered in New York, New York.

Best Financial Stocks To Watch Right Now: C.A. Bancorp Inc Com Npv (BKP.TO)

C.A. Bancorp Inc. is a private equity firm specializing in management buyouts, acquisitions, expansions, restructurings, refinancing, PIPE transactions of middle-market companies, and other alternative investment opportunities. It also participates in open market purchases, equity investments in private issuers, and privatization of public companies. The firm seeks to invest in industrials, real estate, infrastructure, and financial services. Within industrials, it seeks to invest in mature industrial companies with a focus on manufacturing, distribution, and service sectors. The firm�s investment in real estate includes industrial, commercial, healthcare, hospitality, and retail properties. Its infrastructure investment opportunities focus on power generation, transportation, and utilities. Within financial services the firm invests in Canadian and international financial services businesses, including asset managers and investment counselors. From time to time, the firm will seek to invest in Capital Pool Companies within the real estate, infrastructure, and other asset-rich areas. It seeks to invest in the private and public companies based in Canada. The firm�s public investments will focus on mid-market companies trading on the Toronto Stock Exchange. It typically invests between $0.5 million and $20 million in companies with enterprise values between $25 million and $200 million. The firm seeks to pursue investments that offer returns between 1.5 percent and three percent. It seeks a board seat in its portfolio companies. The firm exits its investments through sale to strategic buyers or financial investors, open market sales, normal course retirement of securities, refinancing, and public offerings. It was previously known as C.A. Bancorp Ltd. C.A. Bancorp Inc. is based in Ontario, Canada.

Saturday, August 17, 2013

Best Dividend Companies For 2014

Equity investors who are looking for income are often tempted by a particular stock's dividend yield. We believe they'd be wiser to focus on a company's expected dividend growth. That's the best way to earn long-term total returns.

Look at the amazing results of McDonald's (NYSE: MCD  ) over the past several decades, for example. The company has been able to deliver outstanding total returns by paying out higher and higher dividends each year over an extremely long time horizon. Ultimately, investors are willing to pay higher and higher prices for shares that offer a growing stream of dividends.

Given the importance of dividend growth for driving long-term, total returns, we've identified five remarkable companies that are projected to grow their dividends significantly over the next five years.

Best Dividend Companies For 2014: (BAJAJ-AUT.NS)

Bajaj Auto Limited manufactures and sells scooters, motorcycles, and three wheeler vehicles and spare parts in India and internationally. It sells its two wheeler products under Avenger, Pulsar, Discover, Platina, and Ninja brands. The company also provides three wheeler commercial vehicles, such as goods and passenger carriers. It sells its products and services through a network of two-wheeler and three-wheeler dealers. The company was founded in 1945 and is headquartered in Pune, India. Bajaj Auto Limited operates independently of Bajaj Holdings & Investment Limited as of May 28, 2008.

Advisors' Opinion:
  • [By Admin]

    Unlike cars which are mostly bought through loans, three out of four two-wheelers are bought with own cash. Bajaj Auto would thus be able to bypass the interest rate impact as it seeks growth. After the exit of Honda from Hero Honda, the spotlight is on the second largest two-wheeler maker in the country. Investors who are bearish on Hero Honda could shift to Bajaj for the two-wheeler play. Under managing director Rajiv Bajaj, the company is focussing on a stronger product line and growth opportunity in emerging markets.

Best Dividend Companies For 2014: United Overseas Australia Ltd (EH5.SI)

United Overseas Australia Limited engages in the construction, development, and resale of residential and commercial land and buildings primarily in Australia and Malaysia. It is also involved in the investment of rental properties; and investment of UOA real estate investment trust. The company, formerly known as United Overseas Securities Limited, was founded in 1987 and is based in Osborne Park, Australia.

Best Growth Companies To Invest In 2014: Buffalo Wild Wings Inc.(BWLD)

Buffalo Wild Wings, Inc. engages in the ownership, operation, and franchise of restaurants in the United States. The company provides quick casual and casual dining services, as well as serves bottled beers, wines, and liquor. As of July 26, 2011, it had 773 Buffalo Wild Wings locations in 45 states in the United States, as well as in Canada. The company was founded in 1982 and is headquartered in Minneapolis, Minnesota.

Advisors' Opinion:
  • [By Roberto Pedone]

    Buffalo Wild Wings (BWLD) is an owner, operator and franchiser of restaurants featuring a variety of boldly-flavored, craveable menu items. This stock closed up 6% to $103.58 in Wednesday's trading session.

    Wednesday's Volume: 1.55 million

    Three-Month Average Volume: 402,120

    Volume % Change: 319%

    From a technical perspective, BWLD ripped higher here back above its 50-day moving average of $98.38 with heavy upside volume. This move is quickly pushing shares of BWLD within range of triggering major breakout trade. That trade will hit if BWLD manages to take out its intraday high on Wednesday of $105.32 and then once it clears is 52-week high at $106.03 with high volume.

    Traders should now look for long-biased trades in BWLD as long as it's trending above its 50-day at $98.38 and then once it sustains a move or close above those breakout levels with volume that hits near or above 402,120 shares. If that breakout triggers soon, then BWLD will set up to enter new 52-week-high territory, which is bullish technical price action. Some possible upside targets off that breakout are $110 to $120.

Friday, August 16, 2013

Dollar Cost Averaging

You're dead sure that shares of Unbeatable Software Ltd at Rs 50 are a great investment. Your broker agrees and so you buy a 1,000 shares for Rs 50,000. A week later, the stock's down to Rs 40 and you are carrying a potential loss of Rs 10,000 on your decision. Don't be surprised. This happens to everyone. And, very often.

Buying at Rs40 would have clearly been the smarter thing to do. Unless, the stock's heading to Rs35. The lesson here is 'dead sure' doesn't exist and stock prices (or for that matter, bonds, mutual funds, or anything that has a price) go up and down.

At what price do you buy? Where's the bottom?

Nobody knows, not even your broker. But there is a way around these issues. And it is a strategy that most smart investors adopt. No, it is not complicated. In fact it is quite simple, most practical and could be quite profitable too. Especially, if you are an individual investor.

Let's see how it works.

Instead of investing your Rs50,000 in one lump sum, suppose you had invested a fixed sum of Rs10,000 at the beginning of every week. Your first Rs10,000 would have bought you 200 shares at Rs50. Your second of Rs10,000 would have allowed you to benefit from the lower share price and you would have bought 250 shares this time around, given that the price was down to Rs40. To understand how this investing approach works, refer to the table below. The table depicts likely stock price movements.


Dollar cost averaging
Period Share Price (Rs) Amount Invested (Rs) Shares Bought
Week1 50 10,000 200
Week2 40 10,000 250
Week3 35 10,000 286
Week4 45 10,000 222
Week5 55 10,000 182
Total <   50,000 1,140


In the above example, by following this strategy you would have ended up owning 1,140 shares of Unbeatable Software Ltd as against 1,000 shares if you had bought in one lump sum investment.

The difference is significant - your Rs50,000 goes a bit further. In fact, 140 shares further. This approach of spreading out your investments over time and investing a fixed amount periodically is referred to as Dollar Cost Averaging. The important principle here is that you should invest a fixed amount (dollars, rupees, whatever) and not a fixed number of shares.

The above example represents a fluctuating market. While this approach will clearly further increase the number of shares you own with the same Rs50,000 in a one-way downward trended market, you would lose out in a rising market. But then, none of us can predict short-term price movements consistently and perfectly time ups and downs. Which is why this approach will work quite well most of the time. Basically, Dollar Cost Averaging helps you smoothen the market fluctuations to your advantage and removes the uncertainty of answering the question - At what price do you buy?

The psychological attitude to adopt in practicing Dollar Cost Averaging is simple. If prices are falling, you are better off; if they are rising, Dollar Cost Averaging is the price you pay to minimise losses should the market have gone the other way.


Remember, Dollar Cost Averaging - 
1. works equally well for both buying and selling decisions

2. increases your potential gains when acting against the market trend

3. reduces risk when you are playing the market trend

4. can effectively convert a regular savings plan into a regular investing approach

5. helps you to adopt a disciplined approach to investing

6. relieves you from the pressures of forecasting tops and bottoms

Tuesday, August 13, 2013

Do Stock Investors See Value in Bank of America?

With shares of Bank of America (NYSE:BAC) trading around $12, is BAC an OUTPERFORM, WAIT AND SEE or STAY AWAY? Let's analyze the stock with the relevant sections of our CHEAT SHEET investing framework:

T = Trends for a Stock’s Movement

Bank of America provides various banking and financial products and services for individual consumers, small and middle market businesses, institutional investors, corporations, and governments in the United States and internationally. The company' operates in several segments: Consumer & Business Banking, Consumer Real Estate Services, Global Banking, Global Markets, and Global Wealth & Investment Management. The financial industry has taken some heat in recent years but it is the backbone of the economy and is here to stay. The United States is seeing sustained expansion so Bank of America will continue to see a modest rise in business from operations here. However, the real growth opportunities are coming from fueling outside economies that have significant room for growth. What better company to back growing economies than one that has lived through good and bad times? Through its segments, Bank of America is able to provide the products and services required by consumers and businesses worldwide.

T = Technicals on the Stock Chart are Strong

Bank of America stock has suffered greatly in recent years. From a single digit stock price to a monster rally, the stock has seen its fair share of volatility. Currently, the stock is attempting to regain ground and looks to be headed towards high prices not seen since 2010. Analyzing the price trend and its strength can be done using key simple moving averages. What are the key moving averages? The 50-day (pink), 100-day (blue), and 200-day (yellow) simple moving averages. As seen in the daily price chart below, Bank of America is trading above its rising key averages which signal neutral to bullish price action in the near-term.

BAC

NEW! Discover a new stock idea each week for less than the cost of 1 trade. CLICK HERE for your Weekly Stock Cheat Sheets NOW!

(Source: Thinkorswim)

Taking a look at the implied volatility (red) and implied volatility skew levels of Bank of America options may help determine if investors are bullish, neutral, or bearish.

Implied Volatility (IV)

30-Day IV Percentile

90-Day IV Percentile

Bank of America Options

29.18%

0%

0%

What does this mean? This means that investors or traders are buying a very minimal amount of call and put options contracts, as compared to the last 30 and 90 trading days.

Put IV Skew

Call IV Skew

May Options

Flat

Average

June Options

Flat

Average

As of today, there is an average demand from call buyers or sellers and low demand by put buyers or high demand by put sellers, all neutral to bullish over the next two months. To summarize, investors are buying a very minimal amount of call and put option contracts and are leaning neutral to bullish over the next two months.

On the next page, let’s take a look at the earnings and revenue growth rates and the conclusion…

E = Earnings Are Mixed Quarter-Over-Quarter

Rising stock prices are often strongly correlated with rising earnings and revenue growth rates. Also, the last four quarterly earnings announcement reactions help gauge investor sentiment on Bank of America’s stock. What do the last four quarterly earnings and revenue growth (Y-O-Y) figures for Bank of America look like and more importantly, how did the markets like these numbers?

2013 Q1

2012 Q4

2012 Q3

2012 Q2

Earnings Growth (Y-O-Y)

566.67%

-77.17%

-100%

121.11%

Revenue Growth (Y-O-Y)

5.48%

-25.03%

-28.19%

65.94%

Earnings Reaction

-4.72%

-4.24%

-0.21%

-4.92%

Bank of America has seen mixed earnings and revenue figures over the last four quarters. From these figures, the markets have been expecting more from Bank of America’s recent earnings announcements.

P = Poor Relative Performance Versus Peers and Sector

How has Bank of America stock done relative to its peers, Citigroup (NYSE:C), JPMorgan Chase (NYSE:JPM), Wells Fargo (NYSE:WFC), and sector?

10 Best Undervalued Stocks To Watch Right Now

Bank of America

Citigroup

JPMorgan Chase

Wells Fargo

Sector

Year-to-Date Return

6.80%

18.73%

11.40%

9.89%

10.54%

Bank of America has been a relative underperformer, year-to-date.

NEW! Discover a new stock idea each week for less than the cost of 1 trade. CLICK HERE for your Weekly Stock Cheat Sheets NOW!

Conclusion

Bank of America provides products and services that are essential to global growth and daily operations for consumers and businesses around the world. The stock is attempting to make progress after have a couple of dismal years but earnings and revenue figures have not really impressed investors. Relative to its peers and sector, Bank of America has trailed in year-to-date performance. WAIT AND SEE what Bank of America does this coming quarter.

Monday, August 12, 2013

Does Goldman Sachs Stock Support Rising Prices?

With shares of Goldman Sachs (NYSE:GS) trading around $160, is GS an OUTPERFORM, WAIT AND SEE or STAY AWAY? Let's analyze the stock with the relevant sections of our CHEAT SHEET investing framework:

T = Trends for a Stock’s Movement

Goldman Sachs is engaged in investment banking, securities, and investment management. It provides a range of financial services to a substantial and diversified client base that includes corporations, financial institutions, governments, and high net worth individuals. The company operates in four segments: investment banking, institutional client services, investing and lending, and investment management. Through its segments, Goldman Sachs provides invaluable investment services to consumers and companies worldwide.

As a major piece in the expanding world economy, Goldman Sachs is poised to see increased activity as developing countries continue to grow and companies continue to flourish. On Tuesday morning, Goldman Sachs reported earnings and beat the mean earnings per share analyst estimate by a significant amount. The company also beat the average revenue estimate.

T = Technicals on the Stock Chart are Strong

Goldman Sachs stock has been flying higher over the past year. The stock is now trading near key price levels, where it may need some time before its next move. Analyzing the price trend and its strength can be done using key simple moving averages. What are the key moving averages? The 50-day (pink), 100-day (blue), and 200-day (yellow) simple moving averages. As seen in the daily price chart below (source: Thinkorswim), Goldman Sachs is trading slightly above its rising key averages, which signals neutral to bullish price action in the near term.

GS

Taking a look at the implied volatility and implied volatility skew levels of Goldman Sachs options may help determine if investors are bullish, neutral, or bearish.

Implied Volatility (IV)

30-Day IV Percentile

90-Day IV Percentile

Goldman Sachs Options

24.13%

0%

0%

What does this mean? This means that investors or traders are buying a minimal amount of call and put options contracts as compared to the last 30 and 90 trading days.

Put IV Skew

Call IV Skew

August Options

Flat

Average

September Options

Flat

Average

As of Tuesday, there is an average demand from call buyers or sellers and low demand by put buyers or high demand by put sellers, all neutral to bullish over the next two months. To summarize, investors are buying a minimal amount of call and put option contracts and are leaning neutral to bullish over the next two months.

E = Earnings Are Increasing Quarter-Over-Quarter

Rising stock prices are often strongly correlated with rising earnings and revenue growth rates. Also, the last four quarterly earnings announcement reactions help gauge investor sentiment on Goldman Sachs’s stock. What do the last four quarterly earnings and revenue growth (Y-O-Y) figures for Goldman Sachs look like and, more importantly, how did the markets like these numbers?

Save Time Make Money! A new stock idea each week for less than the cost of a trade. CLICK HERE for your Weekly Stock Cheat Sheets NOW!

2013 Q2

2013 Q1

2012 Q4

2012 Q3

Earnings Growth (Y-O-Y)

107.87%

9.44%

203.29%

439.29%

Revenue Growth (Y-O-Y)

0.21%

1.42%

52.69%

132.80%

Earnings Reaction

-1.79%*

-1.61%

4.05%

-1.02%

Goldman Sachs has seen increasing earnings and revenue figures over the past four quarters. From these numbers, the markets have grown to expect a little more from Goldman Sachs’s recent earnings announcements.

* As of this writing.

P = Average Relative Performance Versus Peers and Sector

How has Goldman Sachs stock done relative to its peers – JPMorgan Chase (NYSE:JPM), Citigroup (NYSE:C), Morgan Stanley (NYSE:MS) — and sector?

Goldman Sachs

JPMorgan Chase

Citigroup

Morgan Stanley

Sector

Year-to-Date Return

25.63%

25.07%

31.07%

37.34%

24.07%

Goldman Sachs has been an average relative performer, year-to-date.

Conclusion

Goldman Sachs is a financial giant that strives to provide valuable financial products and services to consumers and businesses around the world. The company recently released a positive earnings report that may be a positive catalyst for the quarter ahead. The stock has been on a powerful surge higher. However, it is now trading at key where it may need to spend some time. Over the past four quarters, investors in the company have grown to expect a little more from the company’s earnings reports, though earnings and revenue figures have been increasing. Relative to its peers and sector, Goldman Sachs has been an average year-to-date performer. Look for Goldman Sachs to OUTPERFORM.

Saturday, August 10, 2013

Top Small Cap Stocks To Invest In Right Now

Zynga (NASDAQ: ZNGA  ) investors have expressed a lot of optimism over new CEO Don Mattrick, who left Microsoft (NASDAQ: MSFT  ) to take the top spot at the social game maker. Shares have gained more than 20% over the past few days following the announcement that Mark Pincus was relinquishing the CEO title. The problem is that not even Don Mattrick can save Zynga from itself.

Who's still the boss?
For starters, Pincus will still exert tremendous control over the company. The founder is staying on as chairman and chief product officer, so he will largely still determine the most important aspect of Zynga's business: the games. He also still controls 61% of all voting power. Make no mistake: What Pincus says still goes.

Under Pincus' tenure, Zynga rightly garnered negative attention for its habit of shamelessly copying rival games, rebranding them, and cross-selling them to Zynga's large (but declining) user base.

Top Small Cap Stocks To Invest In Right Now: Hot Topic Inc.(HOTT)

Hot Topic, Inc., together with its subsidiaries, operates as a mall- and Web-based specialty retailer in the United States. The company operates Hot Topic and Torrid store concepts, as well as an e-space music discovery concept, ShockHound. Its Hot Topic stores sell music/pop culture-licensed merchandise, including tee shirts, hats, posters, stickers, patches, postcards, books, novelty accessories, CDs, and DVDs; and music/pop culture-influenced merchandise comprising women?s and men?s apparel and accessories, such as woven and knit tops, skirts, pants, shorts, jackets, shoes, costume jewelry, body jewelry, sunglasses, cosmetics, leather accessories, and gift items for young men and women primarily between the ages of 12 and 22. The company?s Torrid stores sells casual and dressy jeans and pants, fashion and novelty tops, sweaters, skirts, jackets, dresses, hosiery, shoes, intimate apparel, and fashion accessories for various lifestyles for plus-size females primarily betw een the ages of 15 and 29. As of July 30, 2011, it operated 636 Hot Topic stores in 50 states, Puerto Rico, and Canada; 145 Torrid stores; and Internet stores, hottopic.com and torrid.com. The company was founded in 1988 and is headquartered in City of Industry, California.

Advisors' Opinion:
  • [By Wyatt Research]

    The teen retailer reported its same-store sales rose 0.4 percent, with same-store sales at its Torrid chain for overweight teens rising 7 percent. Analysts were expecting a decline.

Top Small Cap Stocks To Invest In Right Now: Sky-mobi Limited(MOBI)

Sky-mobi Limited engages in the operation of a mobile application store in the People?s Republic of China. It works with handset companies to pre-install its Maopao mobile application store on handsets and with content developers to provide users with applications and content titles. The users of its Maopao store could browse, download, and purchase a range of applications and content, such as single-player games, mobile music, and books. The company?s Maopao store enables mobile applications and content to be downloaded and run on various mobile handsets with hardware and operating system configurations. It also operates a mobile social network community, the Maopao Community, where it offers localized mobile social games, as well as applications and content with social network functions to its registered members. The company owns proprietary mobile application technology in the cloud computing, the MRP format, and SDK development environment. As of March 31, 2011, it had entered into cooperation agreements with approximately 523 handset companies to pre-install Maopao. The company was formerly known as Profit Star Limited and changed its name to Sky-Mobi Limited in October 2010. Sky-mobi Limited was incorporated in 2007 and is headquartered in Hangzhou, China.

Advisors' Opinion:
  • [By Wyatt Research Staff]

    MOBI hit another 52-week high of $12.15 late last week. The stock continues to surge on increasing volume. The latest advance in share price came after Oppenheimer upgraded the stock to "Outperform".

    Last week, the China-based internet portal and gaming provider giant Sohu.com (Nasdaq: SOHU), announced an advertising agreement with MOBI.

Top Blue Chip Companies To Invest In 2014: OCZ Technology Group Inc(OCZ)

OCZ Technology Group, Inc. designs, develops, manufactures, and distributes computer components for computing devices and systems worldwide. It primarily offers solid state drives, flash memory storage, memory modules, thermal management solutions, AC/DC switching power supply units, and computer gaming solutions. The company?s products are used in industrial equipment and computer systems; computer and computer gaming solutions; mission critical servers and high end workstations; personal computer (PC) upgrades to extend the useable life of existing PCs; high performance computing and scientific computing; video and music editing; home theatre PCs and digital home convergence products; and digital photography and digital image manipulation computers. OCZ Technology Group, Inc. offers its products to retailers, on-line retailers, original equipment manufacturers, systems integrators, and distributors. The company was founded in 2002 and is headquartered in San Jose, Califo rnia.

Advisors' Opinion:
  • [By Wyatt Research]

    The maker of solid state drives for computers reported revenue more than doubled and posted adjusted net income of 1 cent per share. It predicted a full-year revenue rise of at least 65 percent. The share price has jumped 210 percent in the past year.

Top Small Cap Stocks To Invest In Right Now: Voyager Oil & Gas Inc.(VOG)

Voyager Oil & Gas, Inc. engages in the exploration and production of oil and gas in the United States. It primarily focuses on oil shale resource prospects in Montana, North Dakota, Colorado, and Wyoming. As of May 17, 2011, the company controlled approximately 141,500 net acres in the five primary prospect areas comprising 28,000 net acres targeting the Bakken/Three Forks in North Dakota and Montana; 14,200 net acres targeting the Niobrara formation in Colorado and Wyoming; 800 net acres targeting a Red River prospect in Montana; 33,500 net acres in a joint venture targeting the Heath Shale formation in Musselshell, Petroleum, Garfield, and Fergus counties of Montana; and 65,000 net acres in a joint venture in the Tiger Ridge gas field in Blaine, Hill, and Chouteau counties of Montana. It supplies energy and fuel for industrial, commercial, and individual consumers. The company is based in Billings, Montana.

Advisors' Opinion:
  • [By SmallCap Investor]

    Shares of this explorer, which has operations in the Western U.S., crossed back above $3 and have risen 40 percent in the past month, amid increasing investor interest in companies drilling in the Bakken region.

Top Small Cap Stocks To Invest In Right Now: China Metro-Rural Holdings Limited(CNR)

China Metro-Rural Holdings Limited, through its subsidiaries, primarily engages in the development and operation of agricultural logistics and trade centers in northeast China. It also involves in purchasing, processing, assembling, merchandising, and distributing pearls and jewelry products. The company markets its pearls and jewelry products to wholesale distributors and mass merchandisers in Europe, the United States, Hong Kong, and other parts of Asia. In addition, it develops, sells, and leases residential and commercial properties in Hong Kong and the People?s Republic of China. The company is based in Tsimshatsui, Hong Kong.

Advisors' Opinion:
  • [By Wyatt Research Staff]

    The stock moved significantly higher in mid-January and traded in a fairly tight range ever since. However, that could change soon. China's agricultural exports to Japan will grow if radiation continues to seep into the food chain.

    China exported $593 million worth of agricultural goods to Japan last year.

Thursday, August 8, 2013

Should You Trust Your Instincts On Gold?

Recent events in San Francisco and at La Guardia Airport made me recall a terrifying experience years ago. It was my last flight of the year, and I was headed home for Christmas. The plane was speeding down the runway to take off, when the pilot suddenly reversed thrust and slammed on the brakes; the plane shook like I have never experienced before as the pilot aborted the takeoff. As we stopped mere feet from the end of the runway and caught our breath, the pilot came on the intercom and announced, "I'm sorry to frighten you, ladies and gentlemen. I have been flying for many years. There was nothing on our instrument panel that says we have any kind of problem. It just did not feel right, and I want to have some things checked out before we go vaulting into the air."

We taxied back to the gate and several mechanics descended on the plane. Within ten minutes they made the announcement that the flight had been canceled due to mechanical difficulties. As I exited, I stuck my head in the cockpit door and exclaimed, "Captain, I will fly with you any time - thank you! I hope you have a wonderful Christmas season." As a seasoned traveler, it was probably the only time in my life that I was happy about having a flight canceled.

It just doesn't feel right As of this moment, the business columns are blaring headlines about the Dow and the S&P hitting new highs seemingly every other day, even with our modest pull-back in June. At the same time, gold and gold stocks have been taking a beating. If you're like a lot of us at Casey Research and have positions, regardless of size, in gold and silver, it can certainly be a test of courage and patience.

At times like this, it seems appropriate to review why we made certain decisions in light of new facts. Have things changed? Is it time to adjust our holdings? Sell off our metals, back up the truck, or something in between?

As luck would have it, Federal Reserve Vice Chairman Janet Yellen shed some light on the subject recently. Bloomberg's headline from earlier this spring, Yellen Says Fed Should Press on With QE Amid Limited Risk, sums it up well. Basically she reiterated that the Federal Reserve will keep on purchasing $85 billion in government debt for the foreseeable future, even if the current chairman has made suggestions they may consider scaling back at some point (no date given, of course).

And even Fed Chairman Bernanke's recent comments on raising rates were tempered with his strong warning against raising them too soon. OK, no changes here, folks; we will continue to spend money we don't have, and the Fed will cover our butts.

Why pay attention to Ms. Yellen? Because she's the front runner to replace Chairman Bernanke. Someone else may eventually be chosen, but her name is coming up in a lot of conversations.

The same day I read about Ms. Yellen, my copy of BIG GOLD hit my inbox. In the introduction, our own Jeff Clark has this to say about the situation (italics his):

Best High Tech Stocks To Buy For 2014

"[T]he fundamental drivers for investing in gold have not changed. If they had, then we should sell, but clearly they have not. This is a short-term correction within a secular trend, despite what some may proclaim.

The primary impetus for a sustained gold bull market is that government debt is a structural problem, in the US and across the globe. Most of it will never be paid - and more piles up every day, to the tune of tens of billions of dollars. The economies of the world's indebted nations are not and cannot grow fast enough to pay off the debt (GDP shrunk [sic] last quarter in the US, the Eurozone, and Japan), and outright default or restructuring (i.e., a "soft default") isn't an option. The only politically acceptable way out is for government to create the money to service the debt and pay its bills, inflation be damned.

This default-by-inflation has been repeatedly employed by governments throughout history. We don't see a different outcome this time.

The Fed has said it wants inflation - and we're sure it'll get what it wants. No forecast comes with a guarantee, but it seems virtually certain that central banks will continue to print money. Since those currencies can't get "unprinted," they'll eventually enter the system and fuel double-digit rates of price inflation. When that process starts to unfold, gold and silver will respond, as they dependably have throughout history."

And of course I caught a quick glimpse of talking heads on CNBC enthusiastically discussing the Dow. One of the experts made a snide remark that all the gold nuts talking about Zimbabwe need to step aside because they just want to make some money.

Much like the pilot, my intuition is sending me a message. I know I'm heavily in the market with my share of metal and stocks, because I have no choice. They took away our interest income. Most of my peers feel the same way. We are not heavily in the market because we want to be; we really have few other choices.

Maybe the Dow will continue its run up, even with the occasional blips we've seen over the past couple months. But to many of us it feels more like the Great Depression than the roaring '20s. Real unemployment is still through the roof, record numbers of people are on food stamps and disability (just recently the number of those on food stamps of any sort surpassed the number of those working), and we see study after study about our net worth decreasing rapidly. Investors who generally eschew risk have very few outlets for generating real income.

So here is what we should be thinking Let the talking heads at CNBC continue to make fun of us. I think we can do two things at once: make some money and do everything we can to protect ourselves against a possible Zimbabwe moment.

There are certain potential catastrophes that can be so threatening we must take steps to insure ourselves even though the probability of one actually occurring is slim. It's like keeping a small fire extinguisher under your kitchen sink and hoping you never have to use it. I cannot put my life savings and my family at risk by trivializing dangers potentially on the horizon.

While CNBC may want to pooh-pooh the probability of something similar happening in our country, we all know that creating massive amounts of currency out of thin air always results in the currency collapsing, or at the very least being revalued in a way that most of us will suffer from. A prudent investor (particularly one on either side of the cusp of retirement) would do well to take out some insurance. That is generally done by investing in metal, farm land, and other forms of hard assets.

In the same Bloomberg article quoting Ms. Yellen, there is another clue for us: "Kansas City Fed President Esther George has warned that prices of some farm land have hit 'historically high levels.'" I've heard the same thing from folks in America's heartland when I recently visited family in Illinois. I wonder if the CNBC folks think that is a mere coincidence.

In the fall of 2011, I attended the Casey Summit, which featured three speakers who had lived through hyperinflation in their home countries. They shared their personal experiences with us and I shared some of this in an article earlier this summer.

All three speakers went through very similar cycles. All said inflation was rising and then it spiked to astronomical proportions.

The following are a couple of slides used by the speaker from the former Yugoslavia. Note the last line that indicated that during its hyperinflation, prices doubled on average every 1.4 days.


The presenter showed a 500-billion denominated bill, which had the same purchasing power a 500 bill had just 24 months earlier. His slides documented the hyperinflation, starting at 5.00 and building up to 500 billion.

Can this happen in the United States? Are we immune from the natural laws of economics?

We see inflation on the rise in the US and know our government is not telling us the truth about it. We have discussed the record debt and Federal Reserve spending until we are blue in the face. And we know that very few of our elected officials are serious about significant cuts to federal spending to rein in debt and borrowing.

So what do we do right now? I have yet to see anyone present any logical economic premise that concludes that our country will not eventually see a currency collapse. Many have put us down, called us "gold nuts" and the like, and trivialized our concerns. Just show me the facts.

Instead, I see several clues that reinforce my concerns. Throughout history thousands of currencies have collapsed, but precious metals have held their value. It should come as no surprise to learn that over the last few years China, Russia, and many central banks have been stockpiling gold. Germany and Venezuela quietly announced earlier this year that they are repatriating their gold stores overseas—not coincidentally mostly from the US—back to their shores. Not wanting to start a panic or gold rush, they played it down by saying they just think it is easier to store their metal inside their own borders. It sits in a lump and earns no interest whether at home or abroad, so there must be a good reason why they are going through all that effort and expense.

At Casey Research, we have regular editors' conferences. The subject of two of the more animated ones earlier this year was precious metals and the direction of the market. If I may summarize, we came to several conclusions.

We may be in for a rough ride in the short term; however, the fundamental reasons for owning gold and silver have not changed. The reasons to own gold and silver are more evident than ever before. At the end of the day, none of us is selling, and we are going to be ever alert for some terrific buying opportunities as they come up. Sure, all the contraptions on the airplane might be telling us everything is just fine: the Dow reaches new highs; unemployment drops another tenth of a point; and cheap credit is endless. But as experienced pilots, we're reading into the market beyond what the gauges are saying. That's the sort of insight that can mean the difference between a crash landing and a takeoff for the value of your portfolio.

So is gold going to start charging upward or take another nosedive any time soon, or just plod along in a tight range? I don't know. At least not for the short term, but long term it seems the fundamentals point upward. For now we're getting our returns from good-paying, reliable dividend stocks using our monthly income plan. It's a strategy used by thousands of investors who are getting dividend income every month from some of the safest, most stable stocks on the market. I've recently updated a presentation laying out the details of this plan. You can find it here.

Dennis Miller is the author of "Retirement Reboot", a book chronicling his own journey to save his retirement in a low yield, turbulent investing environment and providing readers with actionable ideas for getting their retirement finances back on track. He works with some of the country's top investment managers, authors and analysts to tackle the financial challenges faced by today's retirees. Working with analysts at Casey Research, Dennis created "Miller's Money Forever," a newsletter that provides retirees, and those soon to be retired, with actionable recommendations on how to prepare and maintain a profitable retirement portfolio. Prior to retiring in 2008 Dennis ran a successful consulting business and authored several books on sales management. He was also a regular contributor to the American Management Association and an active international lecturer for 40 years. Find more of Dennis' columns and latest special research reports at millersmoney.com or contact him at dennis@millersmoney.

Wednesday, August 7, 2013

Why Abbott Labs Is Poised to Keep Poppin'

Based on the aggregated intelligence of 180,000-plus investors participating in Motley Fool CAPS, the Fool's free investing community, health care giant Abbott Laboratories (NYSE: ABT  ) has earned a coveted five-star ranking.

With that in mind, let's take a closer look at Abbott and see what CAPS investors are saying about the stock right now.

Abbott facts

Headquarters (founded)

Abbott Park, Ill. (1888)

Market Cap

$58.9 billion

Industry

Health care equipment

Trailing-12-Month Revenue

$40 billion

Management

Chairman/CEO Miles White (since 1999)
CFO Thomas Freyman (since 2001)

Return on Equity (average, past 3 years)

20.6%

Cash / Debt

$8.5 billion / $7.1 billion

Dividend Yield

1.5%

Competitors

Boston Scientific
Johnson & Johnson
Mead Johnson Nutrition

Sources: S&P Capital IQ and Motley Fool CAPS.

On CAPS, 97% of the 2,617 members who have rated Abbott believe the stock will outperform the S&P 500 going forward.

Just last week, one of those Fools, cschweit, succinctly summed up the Abbott bull case for our community:

Undervalued stock as of right now. Biggest growth will come from emerging markets. Will need to deliver to those emerging markets if it will succeed -- which I think it can. A little worried about a major buyout of its major branches. ... Still a strong company with a good future.

10 Best Stocks To Buy Right Now

Abbott Labs has changed forever after losing its branded pharmaceutical business to a spinoff. If you're a current investor, or might be buying shares soon, make sure you truly understand the stock by reading The Motley Fool's brand new premium report on Abbott Labs. The report outlines all of the must-know opportunities and risks, along with a full year of analyst updates to keep you up to speed. Best of all, you can claim this report today by clicking here now.

Tuesday, August 6, 2013

Will These Stocks Stop the Dow's Record Run Today?

This morning's movements in the Dow Jones Industrials (DJINDICES: ^DJI  ) look eerily familiar to those who have been watching the day-to-day movements of the average in recent months. The stock market opened modestly lower this morning, with most blaming general concerns, rather than any specific news, for stocks' lackadaisical open. Yet within the first couple of hours, the Dow overcame its modest decline and turned positive, climbing 15 points as of 12:45 p.m. EDT. The broader market posted similar gains, with the S&P 500 also pushing further into record territory, rising to 1,670.

But some of the Dow's components are under pressure today. Cisco (NASDAQ: CSCO  ) has led the Dow's decliners with a loss of about 1.7%, giving back some of the huge gains the tech giant posted last week. An analyst report this morning noted that despite NetApp's collaboration with Cisco on the FlexPod validated data-center platform, Cisco was unlikely to seek to acquire NetApp. By itself, that doesn't justify the drop in Cisco's share price, but it serves as a reminder that despite Cisco's strong earnings report last week, the industry on the whole is suffering from intense competitive pressure that isn't likely to subside anytime soon.

Merck (NYSE: MRK  ) has also dropped, falling 1.4% after the FDA expressed concerns about the side effects of the company's suvorexant insomnia drug. Citing increased daytime drowsiness and suicidal thoughts, the FDA suggested that a smaller dose might prove equally effective while reducing side effects. A panel of outside experts is expected to rule on the drug's safety later this week, and with so much riding on Merck's ability to boost its pipeline, a negative finding could hurt the company's chances of replacing lost revenue from off-patent drugs as quickly as it had hoped.

Finally, consumer giants Coca-Cola (NYSE: KO  ) and Procter & Gamble (NYSE: PG  ) have both fallen more than 1%. Neither company reported significant news today, but value investors have grown increasingly concerned about the rise in both companies' share prices relative to their earnings. Despite their reputations as defensively oriented stocks that hold up well in market reversals, their above-market multiples seem out of line with the companies' growth prospects. With Coke facing the potential restraint of anti-obesity sentiment and P&G still dealing with activist investors looking over its shoulder, investors in both companies may simply see better opportunities elsewhere.

Once a highflying tech darling, Cisco is now on the radar of value-oriented dividend-lovers. Get the lowdown on the routing juggernaut in The Motley Fool's premium report. Click here now to get started.

#pitch{ margin-bottom: 15px; }
More Expert Advice from The Motley Fool
The Motley Fool's chief investment officer has selected his No. 1 stock for the next year. Find out which stock in our brand-new free report: "The Motley Fool's Top Stock for 2013." I invite you to take a copy, free for a limited time. Just click here to access the report and find out the name of this under-the-radar company.

Sunday, August 4, 2013

New York Wants to Sue Wells Fargo and Bank of America

New York Attorney General Eric Schneiderman has announced that the state  may sue Wells Fargo (NYSE: WFC  ) and Bank of America (NYSE: BAC  ) in the months ahead for violating the mortgage settlement agreement that numerous banks reached last year with 49 states and the federal government. Since a lawsuit has yet to be filed, the markets don't seem to be reacting to the news -- both banks remain relatively unfazed.

Lawsuits are usually bad
In the not so distant past, a new lawsuit was often met with a negative market reaction, with Bank of America's performance usually the one suffering. In fact, the bank's many legal problems are often cited as the bear case to avoid the bank, despite its strong performance over the past year. Its performance yesterday as a result of its settlement with MBIA helps illustrate how much investors take note of its legal situation.  

Wells Fargo has avoided many of the same problems despite similar lawsuits, and is often viewed as the least worrisome of the "too big to fail" banks that dominate the headlines. As the nation's largest mortgage lender -- including $109 billion during the first quarter of 2013 alone -- Wells Fargo seems content avoiding some of the riskier practices that warrant big headlines at some of the other banks and focusing on the business of mortgage writing.

Nevertheless, when news surfaces about its bread and butter business, investors should take note and ensure that the bank is doing everything it can to comply with the settlement it reached last year. If Wells Fargo and Bank of America have violated the settlement agreement, it would be in their best interest to address the complaint.

Settlement monitor should come first
Under the terms of the settlement, the mortgage servicers are afforded the opportunity to work with the settlement monitor to address potential violations before being sued to fix the errors. In this regard, Schneiderman may be jumping the gun a bit, but he also has a duty to protect the citizens of New York in matters such as this, and stated that he only seeks an injunction requiring the banks to comply with the settlement, and not any damages or pernalties.

The settlement monitor, former North Carolina Banking Commissioner Joe Smith, said he appreciates Schneiderman's interest  in the issue, and that he is in the process of reviewing the banks' compliance, with a report of his findings coming in June . This report could be the final impetus for Schneiderman to follow through on his lawsuit, so perhaps the market is giving the banks the benefit of the doubt in the meantime.

Wells Fargo's dedication to solid, conservative banking helped it vastly outperform its peers during the financial meltdown. Today, Wells is the same great bank as ever, but with its stock trading at a premium to the rest of the industry, is there still room to buy, or is it time to cash in your gains? To help figure out whether Wells Fargo is a buy today, I invite you to download our premium research report from one of The Motley Fool's top banking analysts. Click here now for instant access to this in-depth take on Wells Fargo.

#pitch{ display: none; }
More Expert Advice from The Motley Fool
The Motley Fool's chief investment officer has selected his No. 1 stock for the next year. Find out which stock in our brand-new free report: "The Motley Fool's Top Stock for 2013." I invite you to take a copy, free for a limited time. Just click here to access the report and find out the name of this under-the-radar company.

Saturday, August 3, 2013

Has Vishay Precision Group Made You Any Real Money?

Although business headlines still tout earnings numbers, many investors have moved past net earnings as a measure of a company's economic output. That's because earnings are very often less trustworthy than cash flow, since earnings are more open to manipulation based on dubious judgment calls.

Earnings' unreliability is one of the reasons Foolish investors often flip straight past the income statement to check the cash flow statement. In general, by taking a close look at the cash moving in and out of the business, you can better understand whether the last batch of earnings brought money into the company, or merely disguised a cash gusher with a pretty headline.

Calling all cash flows
When you are trying to buy the market's best stocks, it's worth checking up on your companies' free cash flow once a quarter or so, to see whether it bears any relationship to the net income in the headlines. That's what we do with this series. Today, we're checking in on Vishay Precision Group (NYSE: VPG  ) , whose recent revenue and earnings are plotted below.

Source: S&P Capital IQ. Data is current as of last fully reported fiscal quarter. Dollar values in millions. FCF = free cash flow. FY = fiscal year. TTM = trailing 12 months.

Over the past 12 months, Vishay Precision Group generated $12.8 million cash while it booked net income of $11.7 million. That means it turned 5.9% of its revenue into FCF. That sounds OK.

All cash is not equal
Unfortunately, the cash flow statement isn't immune from nonsense, either. That's why it pays to take a close look at the components of cash flow from operations, to make sure that the cash flows are of high quality. What does that mean? To me, it means they need to be real and replicable in the upcoming quarters, rather than being offset by continual cash outflows that don't appear on the income statement (such as major capital expenditures).

For instance, cash flow based on cash net income and adjustments for non-cash income-statement expenses (like depreciation) is generally favorable. An increase in cash flow based on stiffing your suppliers (by increasing accounts payable for the short term) or shortchanging Uncle Sam on taxes will come back to bite investors later. The same goes for decreasing accounts receivable; this is good to see, but it's ordinary in recessionary times, and you can only increase collections so much. Finally, adding stock-based compensation expense back to cash flows is questionable when a company hands out a lot of equity to employees and uses cash in later periods to buy back those shares.

So how does the cash flow at Vishay Precision Group look? Take a peek at the chart below, which flags questionable cash flow sources with a red bar.

Source: S&P Capital IQ. Data is current as of last fully reported fiscal quarter. Dollar values in millions. TTM = trailing 12 months.

When I say "questionable cash flow sources," I mean items such as changes in taxes payable, tax benefits from stock options, and asset sales, among others. That's not to say that companies booking these as sources of cash flow are weak, or are engaging in any sort of wrongdoing, or that everything that comes up questionable in my graph is automatically bad news. But whenever a company is getting more than, say, 10% of its cash from operations from these dubious sources, investors ought to make sure to refer to the filings and dig in.

Vishay Precision Group's issue isn't questionable cash flow boosts, but items in that suspect group that reduced cash flow. Within the questionable cash flow figure plotted in the TTM period above, stock-based compensation and related tax benefits provided the biggest boost, at 5.5% of cash flow from operations. Overall, the biggest drag on FCF came from capital expenditures, which consumed 39.5% of cash from operations.

A Foolish final thought
Most investors don't keep tabs on their companies' cash flow. I think that's a mistake. If you take the time to read past the headlines and crack a filing now and then, you're in a much better position to spot potential trouble early. Better yet, you'll improve your odds of finding the underappreciated home-run stocks that provide the market's best returns.

Looking for alternatives to Vishay Precision Group? It takes more than great companies to build a fortune for the future. Learn the basic financial habits of millionaires next door and get focused stock ideas in our free report, "3 Stocks That Will Help You Retire Rich." Click here for instant access to this free report.

We can help you keep tabs on your companies with My Watchlist, our free, personalized stock tracking service.

Add Vishay Precision Group to My Watchlist.

Best Tiny Stocks For 2020

Best Tiny Stocks For 2020