BALTIMORE (Stockpickr) -- Sure enough, stocks are bouncing in a big way in September.
Last week, in this column, the picture looked pretty clear: the S&P 500 was setting up for a bounce off of the trend line that's acted like a floor for shares since all the way back in November. And now, we're getting pretty strong confirmation that buyers are jumping into the market again. The August correction is very broken at this point, and the S&P is just 1.3% away from the all-time highs the big index set more than a month ago.
New month, new market indeed.
As strong as the situation looks in the broad market, it's even more tradable in a handful of individual names this week. That's why today, we're taking a technical look at five of them.
If you're new to technical analysis, here's the executive summary.
Technicals are a study of the market itself. Since the market is ultimately the only mechanism that determines a stock's price, technical analysis is a valuable tool even in the roughest of trading conditions. Technical charts are used every day by proprietary trading floors, Wall Street's biggest financial firms, and individual investors to get an edge on the market. And research shows that skilled technical traders can bank gains as much as 90% of the time.
Every week, I take an in-depth look at big names that are telling important technical stories. Here's this week's look at five high-volume stocks to trade this week.
Walgreen
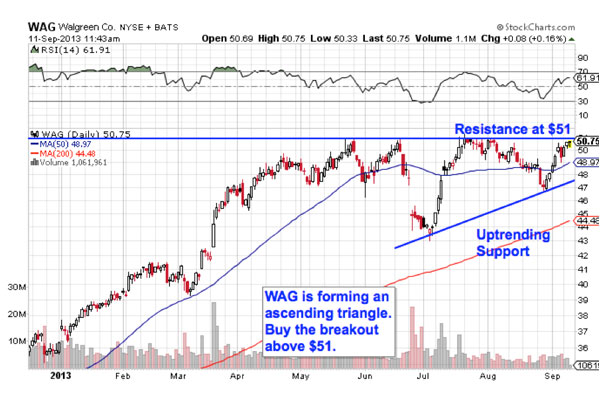
There's no two ways about it – 2013 been a stellar year for shares of Walgreen (WAG). The $48 billion retail pharmacy giant has rallied more than 36% since the calendar flipped to January, and now, there's reason to believe that WAG could be headed for even higher ground. Here's how to trade it...
Walgreen is currently forming an ascending triangle pattern, a bullish setup that's formed by horizontal resistance above shares at $51, and uptrending support to the downside. As WAG bounces in between those two technically important levels, it's getting squeezed closer and closer to a breakout. When the move above $51 happens, it makes sense to be a buyer.
The 50-day moving average has been acting like a pretty good proxy for support in the very short-term. If you decide to jump in after the breakout, that's a good place to keep a protective stop.
Apple
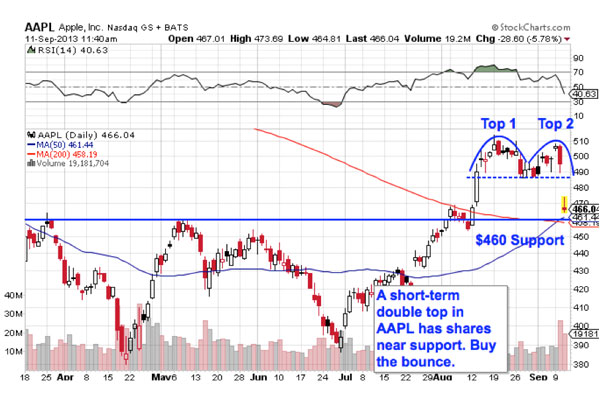
Apple (AAPL) has been the one exception to buying pressure this week. The $430 billion tech giant got shellacked after announcing its new iPhone models on Tuesday, down more than 5% in yesterday's session as sellers logjammed orders into the market. But risk takers could have a big buying opportunity on their hands this week.
In the short-term, Apple was forming a double top, a bearish pattern formed by two swing highs that stall out at approximately the same price level. The sell signal happened quickly – it triggered when AAPL gapped down below $490 yesterday morning, giving few traders a chance to act. But what's important is that Apple almost immediately found its downside price objective at $468, a level right above a key support level at $460. In other words, this giant hated stock looks likely to bounce here.
Whenever you're looking at any technical price pattern, it's critical to think in terms of buyers and sellers. Triangles, double tops, and other price pattern names are a good quick way to explain what's going on in this stock, but they're not the reason it's tradable -- instead, it all comes down to supply and demand for shares.
That support line at $460, for example, is a price where there is an excess of demand for shares; in other words, it's a place where buyers have been more eager step in and buy shares at lower levels than sellers have been sell. If AAPL holds $460, then buying the bounce becomes a much lower risk proposition. Just keep a tight stop in place.
General Electric
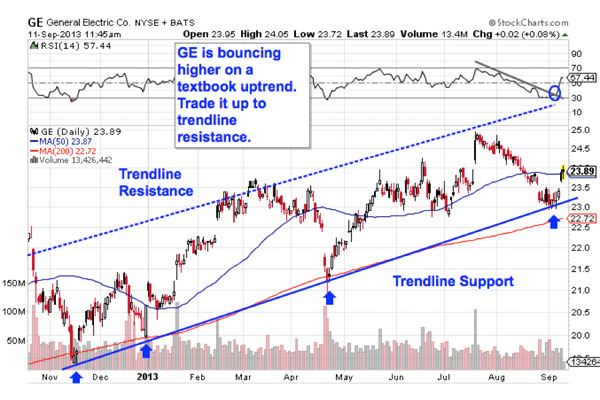
Things are a little more straightforward in shares of General Electric (GE). GE is another name that's bounced higher alongside the broad market for the last ten months, and you don't have to be an expert technical analyst to figure out what's going on in shares from here. This stock is in a textbook uptrending channel right now.
General Electric pinballed off of trend line support this week, gapping higher as shares caught a bid at their long-term price floor. And generally speaking, it makes sense to buy the bounce for two big reasons: it's the spot where shares have the furthest to move up before they hit resistance, and it's the spot where the risk is the least (because shares have the least room to move lower before you know you're wrong).
Momentum adds some extra confirmation to the move; the 14-day RSI line broke its downtrend at the start of the week, a signal that's historically been followed by a three-month rally period. If you decide to pick up shares here, consider unloading before they get too close to trend line resistance.
Berkshire Hathaway
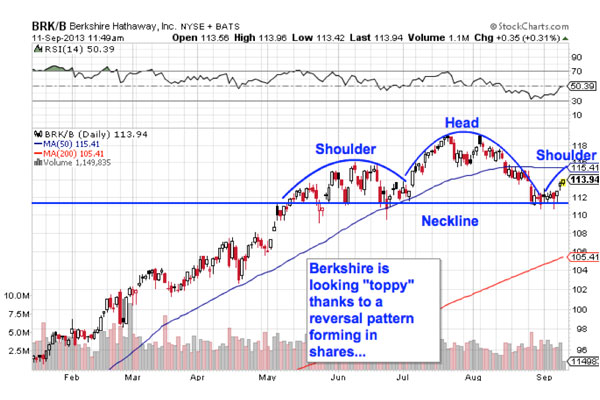
Not all the names we're looking at are bullish setups -- Berkshire Hathaway (BRK.A) is starting to look "toppy" right now. And investors who own this name should take note.
Berkshire Hathaway has stomped the broad market's impressive performance this year, climbing almost 30% year-to-date. But Berkshire broke its uptrend on this latest correction, and it's currently in the late stages of forming a head and shoulders top: a bearish reversal pattern that indicates exhaustion among buyers. The head and shoulders is formed by two swing highs that top out around the same level (the shoulders), separated by a bigger peak called the head; the sell signal comes on the breakdown below the pattern's "neckline" level, which is right at $111 at the moment. A drop below that $111 level is the major sell signal for this stock.
Lest you think that the head and shoulders is too well known to be worth trading, the research suggests otherwise: a recent academic study conducted by the Federal Reserve Board of New York found that the results of 10,000 computer-simulated head-and-shoulders trades resulted in "profits [that] would have been both statistically and economically significant."
5 Best Sliver Stocks For 2015
The case in point comes from the last name we're looking at today...
China Mobile
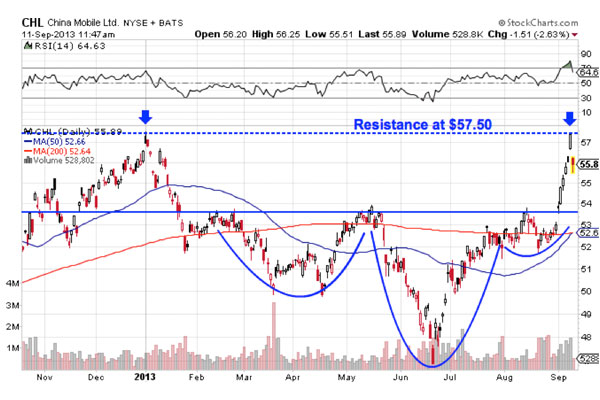
Last up is Chinese phone carrier giant China Mobile (CHL). This phone stock had been forming an inverse head and shoulders setup, the bullish opposite of the pattern in Berkshire Hathaway. We actually looked at this name a week ago, when shares had just broken out above their own neckline to trigger a buy. If you haven't already, now's the time to sell.
CHL showed traders a textbook breakout in the last week, filling the space between the neckline at $54 and previous resistance at $57.50 -- that resistance level got set back in January, when CHL previously got swatted down by profit taking. Yesterday's big bounce off of resistance is a good indicator that sellers are still holding strong at that level, so short-term traders should take their gains here...
To see this week's trades in action, check out this week's Must-See Charts portfolio on Stockpickr.
-- Written by Jonas Elmerraji in Baltimore.
RELATED LINKS: >>5 Tech Stocks Spiking on Big Volume>>5 Stocks Setting Up to Break Out
>>4 Red-Flag Stocks to Sell This Fall
Follow Stockpickr on Twitter and become a fan on Facebook.
At the time of publication, author was long AAPL.
Jonas Elmerraji, CMT, is a senior market analyst at Agora Financial in Baltimore and a contributor to TheStreet. Before that, he managed a portfolio of stocks for an investment advisory returned 15% in 2008. He has been featured in Forbes , Investor's Business Daily, and on CNBC.com. Jonas holds a degree in financial economics from UMBC and the Chartered Market Technician designation.
Follow Jonas on Twitter @JonasElmerraji
No comments:
Post a Comment